



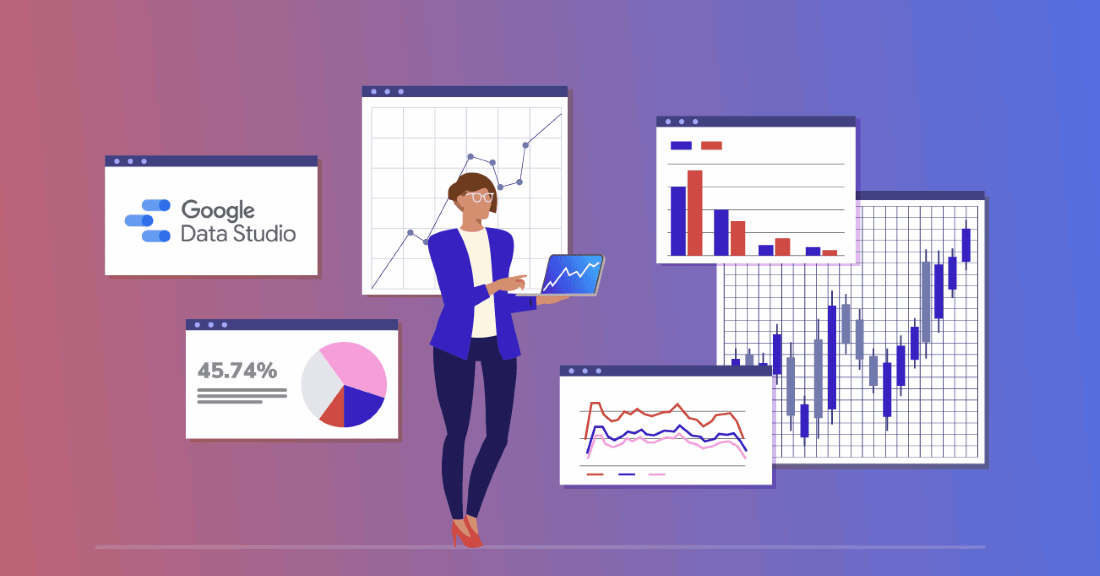

Data-Driven Marketing with Google Data Studio by Xplore Digital
In today’s world where everything is counted on data. There are various methods and technologies devised only for the collection and reporting of data using features of artificial intelligence and machine learning. Xplore Digital has used Google’s free duplicate and reporting tool since 2016, benefiting from Google’s regular updates and improvements. However, if you ask any marketers regarding the tools they optimally use for the purpose of reporting, data studio would be the sure thing you will get as an answer. It helps them organize data, create clear reports, and understand marketing performance more easily.
How Data Studio Simplifies Data Visualization and Reporting by xplore digital
Data studio works wisely in a way that helps to connect with different data sources and completely automate the reporting work. However, here it should be your decision to select which virtualizations will be suitable for your audience. One of such ways is to use performance dashboards which are one of the finest ways to display data. The data is presented in a simple, easy-to-understand format, with flexible colors and clear contrast options. Another useful feature is the ability to create tables in Data Studio. Here you don’t have to worry about anything like making basic tables in an Excel sheet.There are all the features like, bar graphs, colours, charts, heat maps, targets, and time contrast.
Ad Placement, Video Tracking, and Performance Comparison
Another benefit which adds up down the line is ad placements on various websites using data studio features. Your clients can choose from the library and make a list of websites where they wish to publish their advertisements. Also, Digital Marketing Company features to link to some YouTube channel where people can see the details in the form of a video which is, even more, better and involving. You can define the results and keep the records in your database including the video views and rates. You can also do a contrast between two periods of time and drive out your progress. This can help you identify changes, understand what is improving, and find areas that may need more attention.
Using Google Trends and Analytics to Discover Marketing Insights

Occasionally, Google Trends reveals an “out-of-the-box” feature. If your clients’ performance changes over time, these insights can show new patterns and opportunities. They will definitely wish to know the reason behind such a change. Google Trends shows seasonal impacts on ad performance, while Google Sheets helps you download and verify the data.
Google Analytics works in a similar fashion and is another tool for your reference which is helpful in the origin of relationships between channels and time ranges. It also provides valuable insights into user behavior, website performance, and the effectiveness of different marketing channels. These insights help businesses identify areas for improvement, understand customer preferences, and make better decisions about their future marketing strategies. They also allow businesses to adjust their approach based on changing customer needs and market trends.
Conclusion
In Conclusion, This is useful in the total calculation of the revenue generation and decides the channel’s contribution to that. You can also create regular reports, bullet charts, and time-based charts for closer monitoring. Data visualization helps present the bigger picture clearly. A Digital Marketing Agency like Xplore Digital uses these insights to optimize campaigns, improve targeting, and get better results for clients. By analyzing performance data regularly, businesses can make informed decisions, improve their strategies, and achieve more consistent online growth.